31.02.610 Economic development issues.
The Growth Management Act encourages economic development throughout the State that is consistent with adopted comprehensive plans, promotes economic opportunity for all citizens, especially for unemployed and for disadvantaged persons, supports growth in areas experiencing insufficient economic growth, all within the capacities of the area’s natural resources, public services, and public facilities.
RCW 36.70A.070(7) more specifically requires that Comprehensive Plans include, “(A)n economic development element establishing local goals, policies, objectives, and provisions for economic growth and vitality and a high quality of life. The element shall include: a summary of the local economy such as population, employment, payroll, sectors, businesses, sales, and other information as appropriate; a summary of the strengths and weaknesses of the local economy defined as the commercial and industrial sectors and supporting factors such as land use, transportation, utilities, education, work force, housing, and natural/cultural resources; and an identification of policies, programs, and projects to foster economic growth and development and to address future needs.”
(1) Population. As of 2005, the Forecasting Division of the Washington State Office of Financial Management (OFM) estimated Clallam County’s population (including incorporated areas) at 66,800, which is approximately a four percent increase (one percent annualized rate) from the Census population of 64,179 in 2000 and approximately 18 percent increase (1.2 percent annualized rate) from the Census population of 56,464 in 1990. According to the OFM, the majority of population increase has been due to in-migration. In 2002, OFM projections estimated that Clallam County’s resident population would increase to as much as 72,383 by 2010 and 81,894 by 2020.
(2) Employment. The Washington State Employment Security Department (WSESD) maintains a database of employment data called the Quarterly Census Employment and Wages (QCEW). The data is categorized according to the “North American Industry Classification System” (NAICS) a standardized system used by federal statistical agencies for classifying business establishments. The QCEW data provides information on the number of firms, employees, and wages per NAICS category. It should be noted that since the data is obtained from tax information that the data is underestimated because it only reflects those businesses in Clallam County that have unemployment insurance and are not sole proprietorships. In addition, WSESD suppresses some of the data specifics to ensure confidentiality to individual businesses. There are two forms of suppression:
(a) If there are less than three firms for a NAICS classification, then the information is suppressed and reported as an * in the database; and
(b) If any one firm contains more than 80 percent of the employee wage, then the information is suppressed and reported as an * in the database.
The QCEW data is designated into 23 main NAICS business categories with smaller classifications under each larger division. For these purposes only the large business categories have been included and where specified some of the business categories have been combined. For example, real estate has been combined with finance and insurance forming a sector called finance, insurance, and real estate (F.I.R.E.). The following employment, payroll and covered wage, and business sector and trend information in this section is based upon 1994 through 2004 QCEW data. The total wages and average monthly wage per sector have been converted to 2004 dollars for easier comparison among QCEW data from different years. Table 31.02.610(A) provides a listing of the industry categories, average number of firms, average number of employees, and total wages for Clallam County in 2004.
|
Table 31.02.610(A) – WSESD QCEW 2004 Data for Clallam County |
|||
|---|---|---|---|
|
Average Number of Firms |
Average Number of Employees |
Total Wages |
|
|
Agriculture, Forestry, Fishing & Hunting (A.F.F.H.) |
91 |
581 |
$18,676,935 |
|
Accommodations and Leisure1 |
229 |
2,386 |
$27,778,696 |
|
Construction |
329 |
1,314 |
$42,154,454 |
|
Finance, Insurance, and Real Estate (F.I.R.E.) |
136 |
716 |
$19,235,932 |
|
Government2 |
102 |
6,465 |
$234,526,221 |
|
Healthcare and Social Assistance3 |
203 |
2,106 |
$47,250,634 |
|
Information |
21 |
307 |
$8,846,116 |
|
Manufacturing |
80 |
1,254 |
$45,414,342 |
|
Mining |
4 |
15 |
$379,792 |
|
Retail/Wholesale Trade |
324 |
3,687 |
$92,712,114 |
|
Other Services4 |
740 |
2,091 |
$49,057,304 |
|
Transportation, Warehousing, and Utilities (T.W.U.) |
86 |
551 |
$15,578,572 |
|
TOTALS |
2,345 |
21,473 |
$601,611,112 |
Source: WSESD (2005)
1 Accommodations and leisure refer to accommodations, food services, arts, entertainment, and recreation.
2 Government is comprised of public education; cities, counties, tribes, state, and federal agencies; and the hospital.
3 Health care and social assistance includes ambulatory health care services, nursing and residential care facilities, and social assistance such as emergency relief, child day care, and community food and housing services.
4 Other services include administrative, waste, professional and technical, and educational services; repair and maintenance; personal and laundry; membership organizations and associations; private households; and all other services not separated into other categories listed above.
Washington State Employment Security Department Local Area Unemployment Statistics (LAUS) figures estimated County resident civilian employment in 2004 of 26,700 workers out of a total work force of 28,670, with an estimated 1,970 being unemployed. LAUS data differs from QCEW data because it reflects employment for civilian residents of Clallam County even if they are working in another county and includes employees that are not covered by unemployment insurance while QCEW data deals only with jobs in Clallam County and only those jobs covered by unemployment insurance. Using QCEW 2004 data, government employees (including those employed by public education, the hospital, and cities, counties, tribes, state and federal agencies) comprised the largest number of employed in Clallam County, with 6,465. Retail/wholesale trade employees had the second largest numbers (3,687), while accommodation and leisure activities (including food services, arts, entertainment, and recreation) and health care/social assistance workers comprised the third and fourth largest numbers of employed (2,386 and 2,106 workers, respectively).
According to the Washington State Employment Security Department (LAUS) figures, Clallam County’s unemployment rate was higher than the Washington state average between 1998 and 2004. Generally, its rate was more than one percent higher than the Washington state average. However, in 2004, County unemployment rates decreased to 6.9 percent, settling just above the State average of 6.2 percent.
The Washington State Employment Security Department (WSESD) using QCEW data reports that there was a total monthly average of 2,345 employers (excluding sole proprietorships as discussed earlier) in Clallam County in 2004. The largest number of firms occurred in the services industry. Based on the number of employers per sector as of 2004, the majority of County businesses were service-oriented (excluding healthcare and social assistance) at 740, followed by construction trades (329) and retail and wholesale (324). Mining and information sectors had the least number of firms at four (4) and twenty-one (21), respectively.
(3) Payroll. As of 2004, government, services (including health/social services and other services), and retail/wholesale trade industries comprised the top three wage providers in Clallam County, at approximately $234 million (m), $96 m (including $47 m for health/social services), and $93 m, respectively. At the opposite end of the scale, the mining industry provided approximately $0.4 m in wages, while the transportation/warehousing/utilities and agriculture/forestry/fishing industries generated approximately $16 m and $19 m, respectively (WSESD, 2005).
(4) Business Sectors and Trends. Businesses in Clallam County have historically been centered around natural resource-based industries such as timber extraction, fishing, and wood products manufacturing. In recent decades however, service-related industries have outpaced the growth of large-scale resource-based businesses. Based on the number of employers per sector as of 2004, the majority of County businesses were service-oriented (excluding healthcare and social assistance), followed by construction trades and retail and wholesale. Though timber extraction, fishing, agriculture, mineral extraction, and other natural resource industries have declined in recent years, they are still important facets of Clallam County’s economy. The conversion of natural resources to product continues to be a substantial industry, providing living wage jobs to large segments of the County’s population. Wood products manufacturing, for example, provided over $15 million in wages, in 2004 (WSESD, 2005). Sustainable economic development in Clallam County will require support and balance between a diverse range of industries in order to avoid major County-wide impacts, due to market fluctuations within a single or limited number of industries.
Figures 31.02.610(A), (B), and (C) depict QCEW data for Clallam County for the time period of 1994 through 2004 in order to visualize trends in the business sectors. All total wages per sector have been converted to 2004 dollars for easier comparison among data from different years. Changes in total wages, number of employees, and number of firms have been calculated both as a change in percent from 1994 to 2004 and as an annualized average growth rate in percent. For example, given the text twenty-four (24) percent (2.5 percent) or (twenty-four (24) percent, 2.5 percent) the first percentage indicates the percent change from 1994 to 2004, in this case twenty-four (24) percent, and the second percent will be the annualized growth rate, in this case 2.5 percent.
Based on the Washington State Employment Security Department total wages per sector data, total wages increased steadily from 1994 through 2004, approximately a twenty-seven (27) percent (2.4 percent annualized rate) increase from 1994 through 2004. Out of a total of twelve (12) sectors listed in Table 31.02.610(A) and shown in Figure 31.02.610(A) the strongest growth from 1994 through 2004 occurred within services (excluding health/social services) (seventy-five (75) percent, 5.7 percent), construction (sixty (60) percent, 4.8 percent), health/social services (fifty-five (55) percent, 4.5 percent), and government (thirty-seven (37) percent, 3.2 percent). Increases in growth also occurred in retail/wholesale (thirty-one (31) percent, 2.8 percent), agriculture/forestry/fishing (thirty (30) percent, 2.6 percent), information (twenty-two (22) percent, 2.0 percent), F.I.R.E. (finance, insurance, and real estate) (nineteen (19) percent, 1.8 percent), transportation/warehousing/utilities (fourteen (14) percent, 1.3 percent), and accommodation and leisure industries (eleven (11) percent, 1.1 percent). During this timeframe, the mining industry significantly declined (negative fifty-nine (-59) percent, -8.5 percent), as well as manufacturing (negative twenty-six (-26) percent, -2.9 percent). Government had significantly higher total wages than any of the other business categories. Retail and wholesale trades had the second highest total wages for the 1994 through 2004 timeframe.
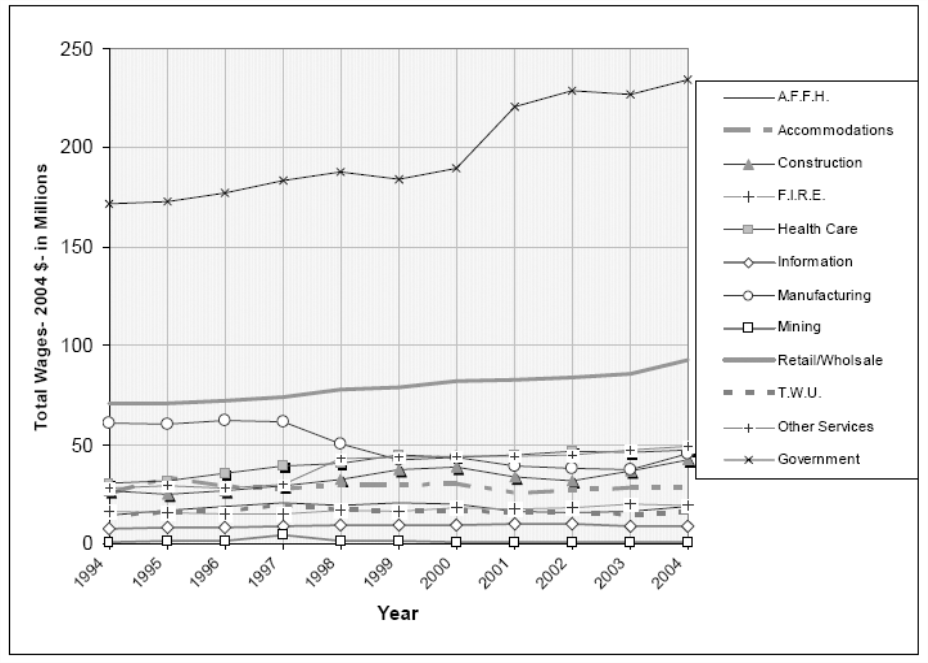
Figure 31.02.610(A) – Total Wages in Clallam County from 1994 through 2004.
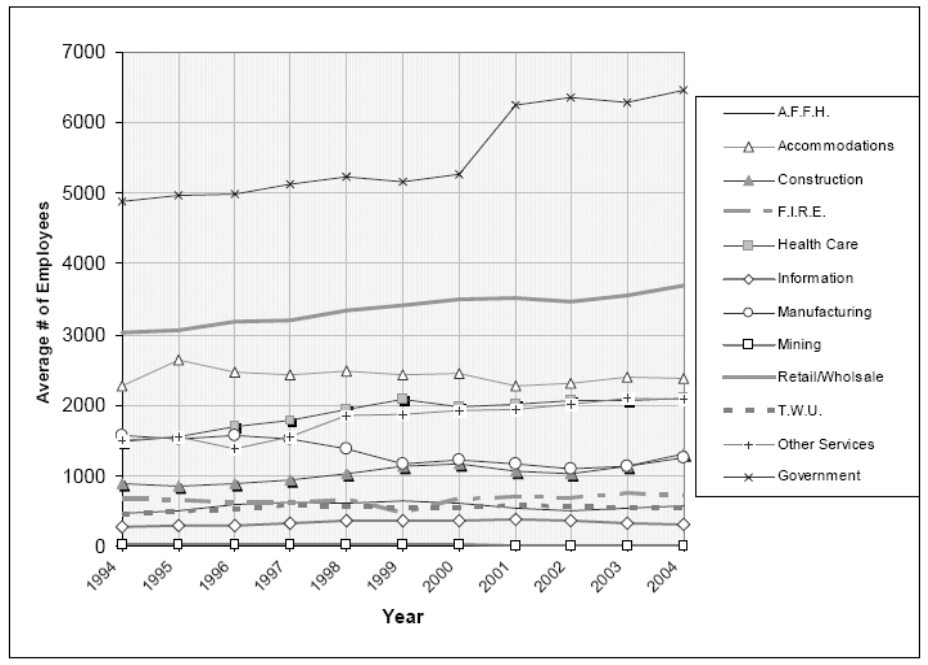
The average number of employees increased steadily from 1994 through 2004, showing a similar pattern of approximately twenty-one (21) percent (1.9 percent annualized rate) overall employee increase from 1994 through 2004 as shown in Figure 31.02.610(B). Government had significantly higher total number of employees than any of the other business categories with retail and wholesale trades second. The strongest growth in employees from 1994 through 2004 occurred within construction (forty-seven (47) percent, 3.9 percent), health/social services (forty-one (41) percent, 3.5 percent), services (excluding health/social services) (forty (40) percent, 3.4 percent), and government (thirty-three (33) percent, 2.9 percent). Increases in growth also occurred in agriculture/forestry/fishing (twenty-three (23) percent, 2.1 percent), retail/wholesale (twenty-two (22) percent, 2.0 percent), transportation/warehousing/utilities (twenty-one (21) percent, 2.0 percent), information (9.3 percent, 0.9 percent), F.I.R.E. (finance, insurance, and real estate) (eight (8) percent, 0.8 percent), and accommodation and leisure industries (4.6 percent, 0.5 percent). During this timeframe, the number of employees for the mining industry significantly declined (negative fifty-four (-54) percent, -7.6 percent), as well as for manufacturing (negative twenty-one (-21) percent, -2.3 percent).
Figure 31.02.610(B). Average Number of Employees in Clallam County from 1994 through 2004.
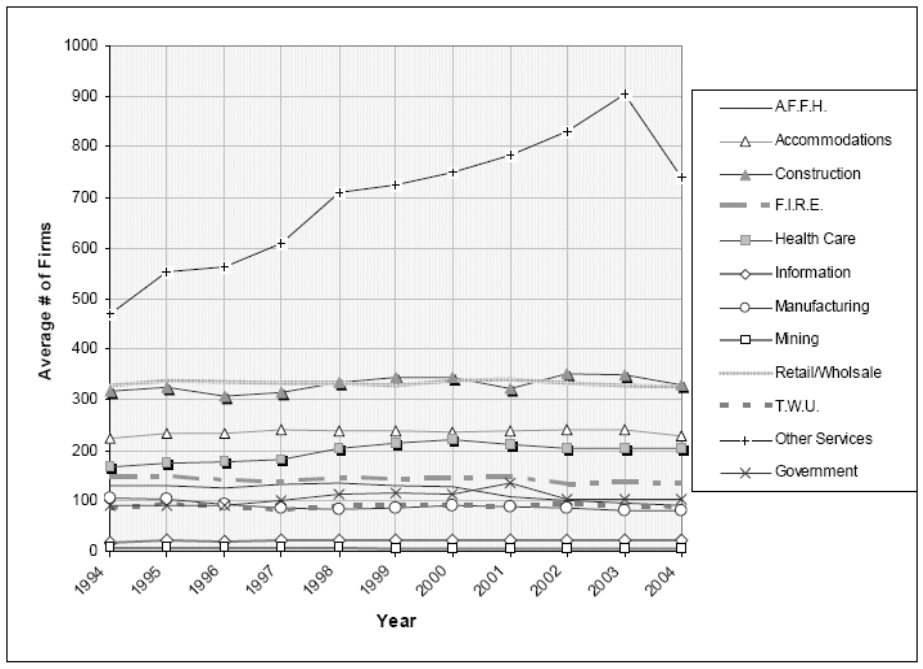
The average number of firms in the County has generally increased from 1994 through 2004 with a dip in 1997 and decline from 2003 to 2004 as shown in Figure 31.02.610(C). The general increase is mostly a reflection of the strong growth in the number of firms in the services sector, an approximate increase of thirty-seven (37) percent (4.6 percent annualized rate). Increases from 1994 through 2004 occurred for health care and social assistance (seventeen (17) percent, 1.9 percent), information (fourteen (14) percent, 1.6 percent), government (eleven (11) percent, 1.2 percent), construction (four (4) percent, 0.4 percent), transportation/warehousing/utilities (two (2) percent, 0.2 percent), and accommodations and leisure (two (2) percent, 0.2 percent). The number of businesses decreased for mining (negative one hundred (-100) percent, -6.7 percent), agriculture/forestry/fishing (negative forty-four (-44) percent, -3.6 percent), F.I.R.E. (negative nine (-9) percent, -0.8 percent), and retail/wholesale (negative one percent, -.1 percent).
Figure 31.02.610(C). Average Number of Firms in Clallam County from 1994 through 2004.
(5) Sales Trends. Sales in Clallam County have generally grown throughout the last decade, from a total of approximately $549 million in 1995 to $896 million in 2004. The largest sales increase occurred in 2004, with an approximately seventeen (17) percent gain compared with 2003.
According to the Washington State Department of Revenue, manufacturing showed the strongest sales gains, increasing approximately eighty (80) percent (sixteen (16) percent annualized rate) between 1998 and 2002. Sales in wholesale trades, however, decreased by approximately nineteen (19) percent (negative five (-5) percent annualized rate) over the same timeframe.
(6) Housing. The amount of construction activity is an indicator of economic growth in the County. Construction of homes represents the greatest percentage of construction activity within Clallam County. Figure 31.02.610(D) shows the amount of residential building activity based on the number of building permits for new homes requested from 1995 through 2004 in unincorporated Clallam County; the cities of Forks, Port Angeles, and Sequim; and the total for Clallam County. The total valuation of building permits for these new homes is shown in Figure 31.02.610(E). The dollar valuations for new residential buildings for 1995 through 2004 have been converted to 2004 dollars for easier comparison of data from different years. (Valuation of new modular/manufactured homes was included for the cities and unincorporated County, except for the city of Forks because Forks does not require cost valuations on permits for new modular/manufactured homes.)
Figure 31.02.610(D). Total Number of Residential Building Permit Requests from 1995 through 2004 in Clallam County.

The number of total building permits in the County decreased from 1995, reached a relative maximum in 1999, decreased sharply by 2000, and has generally increased since 2000. The unincorporated area had its largest number of building permits in 1995 when there were 539 permits requested. From 1996 through 2004 the number of permits requested has remained in the range of 396 to 511 building permits. There has been a fairly steady increase in new residential housing permits in the cities since 1999, reaching a high of 208 building permits in 2004. In 1995 the building permits for the cities were about fifteen (15) percent of the total; by 2004, building permits for the cities were about thirty-two (32) percent of the total building permits for the County.
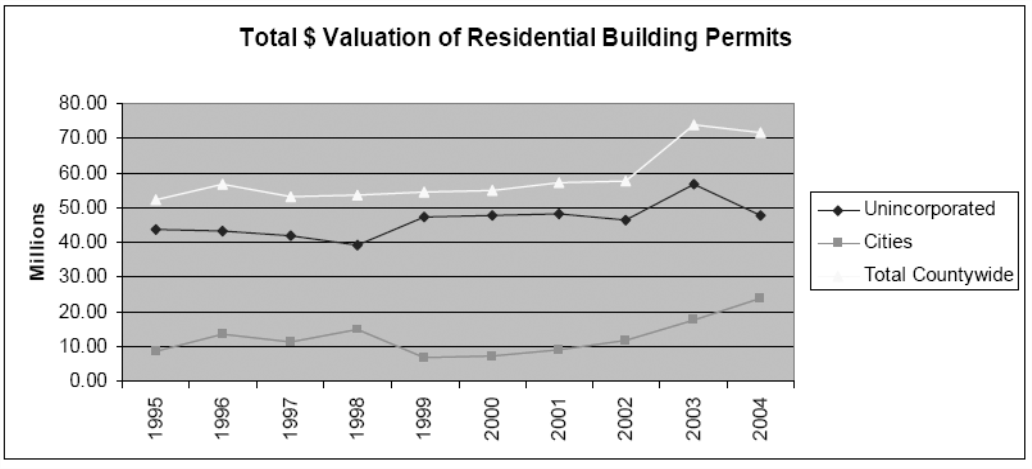
Table 31.02.610(E). Total Dollar Valuation of Residential Building Permits from 1995 through 2004 in Clallam County.
Overall, the County has had a steady increase in the total dollar valuation of new residences in the County since 1997 with a sharp increase from 2002 to 2003 followed by a decrease in 2004. The total dollar valuation for new residences in the cities has increased steadily from 1999 through 2004, with the majority of the increase for the cities occurring in Sequim. The cities’ share of the total dollar valuation of residential building permits in the County increased from sixteen (16) percent in 1995 to thirty-three (33) percent in 2004.
Housing costs in Clallam County have risen significantly since 1998. The rising cost of new and used homes and land has become of concern for many industry sectors such as construction trades, due to a limited workforce able to afford housing within the County.
|
Average Clallam County Single-Family Dwelling prices (County Average): |
||
|---|---|---|
|
1998 |
2004 |
|
|
New |
$148,758 |
$244,786 (64 percent increase, 8.7 percent annualized) |
|
Used |
$128,140 |
$188,834 (47 percent increase, 6.7 percent annualized) |
Source: Digest of Real Estate and Loan Transactions – Clallam County Profile.
|
Median Home Prices as of 1st quarter 2005: |
|
|---|---|
|
Clallam County |
$172,100 |
|
Washington State |
$238,900 |
Source: Washington Center for Real Estate Research/Washington State University.
(7) Supporting Factors.
(a) Land Use Issues. Figure 31.02.610(F) shows the location of Clallam County economic development nodes where commercial, industrial and/or mixed use (C/I) zoning are supported by the land use elements of Clallam County and the cities of Forks, Port Angeles, and Sequim comprehensive plans. In 2004, Clallam County conducted a study of C/I zoned land availability within the County’s six (6) urban growth areas (UGA) and rural commercial nodes. To account for regional differences, land availability was analyzed based on the County’s four (4) Comprehensive Plan Planning Regions: Sequim-Dungeness, Port Angeles, Straits, and Western Planning Regions. Figure 31.02.610(F) shows the location of Planning Regions, UGA, and rural commercial nodes.
The results of the 2004 Clallam County Commercial and Industrial Land Availability study included land use and land availability statistics and maps generated for each UGA and Rural Commercial node represented on Figure 31.02.610(F). In summary, the 2004 study found that there were approximately 8,290 acres of C/I zoned lands in Clallam County. Of that total, approximately 2,832 acres were determined to be vacant and another 753 acres were developed but identified as having a high redevelopment potential. Seventy-three (73) percent of vacant lands were privately owned, with twenty-seven (27) percent publicly owned. Table 31.02.610(B) and Figures 31.02.610(G) and 31.02.610(H) summarize land use characteristics of C/I zoned areas for the County’s six (6) urban growth areas and sixteen (16) rural commercial nodes identified on Figure 31.02.610(F).
Rural commercial zones shown on Figure 31.02.610(F) that are not denoted by a node number were not analyzed for land availability. These rural commercial nodes are isolated and generally developed. In most cases, they are under single ownership.
|
Planning Region |
Developed (acres) |
Vacant- Private (acres) |
Vacant-Public (acres) |
Totals |
|---|---|---|---|---|
|
Sequim Region |
837 |
702 |
76 |
1614 |
|
Sequim UGA |
416 |
3441 |
46 |
806 |
|
Carlsborg UGA |
150 |
58 |
<1 |
208 |
|
Rural Commercial |
271 |
300 |
30 |
600 |
|
Port Angeles Region |
1676 |
480 |
438 |
2594 |
|
Port Angeles UGA |
1412 |
348 |
4302 |
2190 |
|
Rural Commercial |
264 |
132 |
8 |
404 |
|
Straits Region |
430 |
290 |
67 |
787 |
|
Joyce UGA |
155 |
70 |
3 |
228 |
|
Clallam Bay/Sekiu UGA |
274 |
220 |
64 |
558 |
|
Rural Commercial |
N/A3 |
|||
|
Western Region |
1469 |
1361 |
465 |
3295 |
|
Forks UGA |
627 |
794 |
27 |
1448 |
|
Rural Commercial |
842 |
567 |
4384 |
1848 |
|
TOTALS |
4412 |
2832 |
1046 |
8290 |
1 Vacant C/I zoned lands within the Sequim UGA include city-approved commercial developments covering ninety-seven (97) acres with more than 540,000 square feet of commercial space planned.
2 Vacant land includes 260 acres of Port-owned land around William Fairchild International Airport.
3 Not applicable. No rural lands were analyzed in Straits Planning Region.
4 Vacant land includes city of Forks owned land surrounding Quillayute Airport.
Source: Clallam County Department of Community Development, 2004.
Figure 31.02.610(F). Clallam County Planning Regions, Urban Growth Areas, and Rural Nodes.
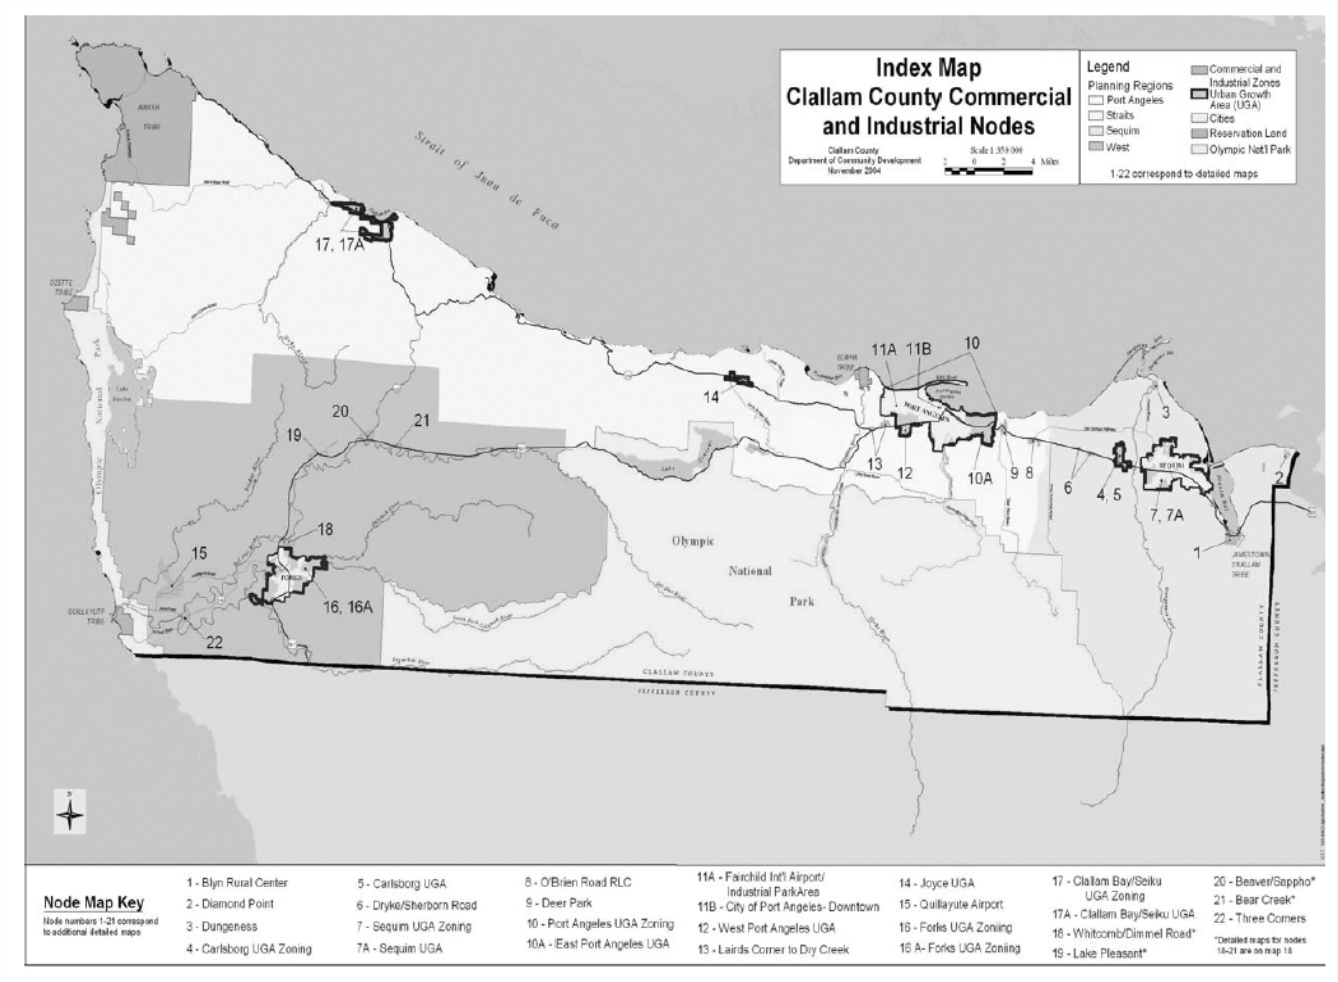
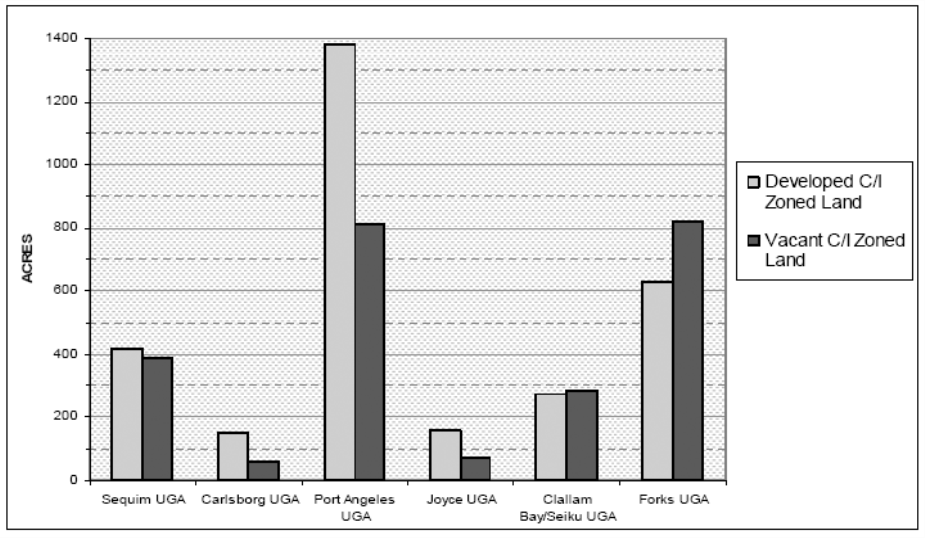
Figure 31.02.610(G). Acres of Vacant and Developed Commercial and Industrial Land within Clallam County UGAs
Notes:
1. Vacant C/I zoned lands within the Sequim UGA include city-approved commercial developments covering ninety-seven (97) acres with more than 540,000 square feet of commercial development.
2. Vacant land includes 260 acres of Port-owned land around William Fairchild International Airport.
Source: Clallam County Department of Community Development, 2004.
Figure 31.02.610(H). Acres of Vacant and Developed Commercial and Industrial Land within Rural Nodes by Planning Region in Clallam County
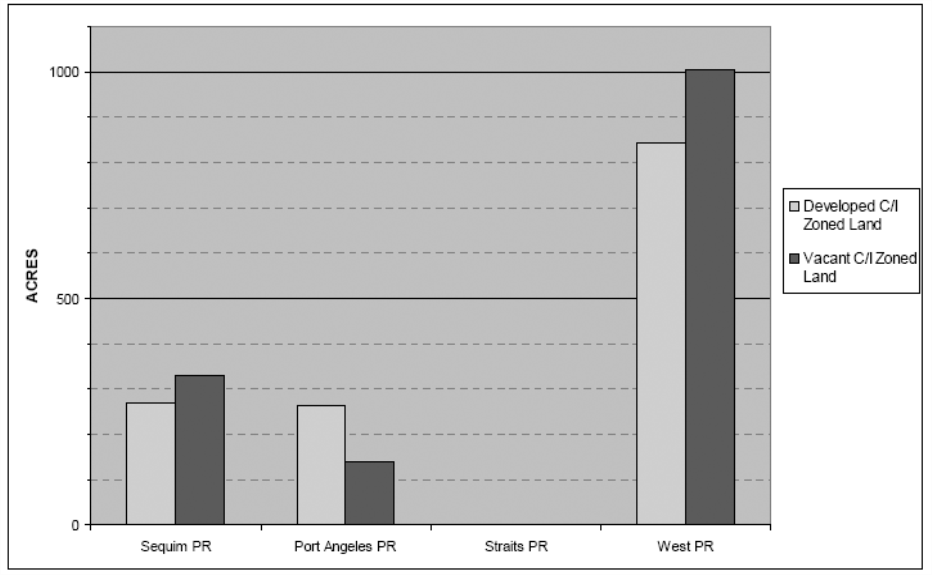
Source: Clallam County Department of Community Development, 2004.
(b) Transportation Issues. The remaining two (2) lane portions of US 101 between Port Angeles and Sequim (and east, to the Hood Canal Bridge) have been identified as issues, due to safety concerns and efficiency of transporting products in and out of the area. Since there is no rail transport available in Clallam County, this issue is of particular concern to industries and businesses in the area.
Clallam County has had a fixed-route public transportation system, Clallam Transit, since October 1980. In 2004, the Clallam Transit System tallied 897,110 total passengers with an average monthly ridership of 62,449, covering a service area of 1,753 square miles with thirteen (13) routes. The Clallam County public transportation system increases the mobility of our citizens regardless of age or abilities, which supports economic development.
There are a total of five (5) general aviation airports in Clallam County (Forks, Quillayute, Fairchild, Sekiu, and Sequim Valley). Airport services at these facilities include passenger and freight transportation, flight instruction, and other related commercial services. Protection of these facilities from incompatible uses is mandated by the Growth Management Act, and is an important element in continued economic growth throughout the County.
To enhance the transportation network in Clallam County, it is recognized that barge transportation with its accompanying upland support facilities needs to be explored. There is limited cargo handling capabilities due to a lack of infrastructure and upland storage areas at marine terminals and the age of infrastructure. Adequate infrastructure should be ensured for the existing ferry services and be explored to support cruise ship operations.
(8) Economic Development Strategy. The Clallam netWorks Economic Development Council (EDC) is a nonprofit organization created to enhance and stabilize the economic environment. The EDC is supported in-part, by County tax dollars. Since 2000, the EDC has promoted an “industry cluster” approach to economic development, encouraging collaboration between similar businesses by facilitating the formation of “cluster teams” to identify and find solutions to industry needs. Industry cluster teams are composed of representatives from the same or similar industries for the purpose of identifying and discussing workforce and industry issues as well as initiating projects that positively impact economic development.
As of 2005, the following industry cluster teams have been organized and actively participate in the program: Agriculture, Building Trades, Education/Training Centers of Excellence, Finance (“Olympic Peninsula Finance Advisory Network” (OPFAN)), Forest Resources, Health Services (“Transforming Healthcare in Clallam County” (THCC)), Information Technology, Marine Services, and Tourism (Tourism Strategic Planning Team).
(a) Agriculture. The Agriculture Industry Cluster Team consists of local agricultural producers of produce, seed, livestock, fiber, lavender and cheese products, in addition to the WSU Extension, conservation organizations such as “Friends of the Fields,” education representatives, and private citizens. Interest has more recently broadened to include nonagricultural food enterprises such as seafood and artisan bread. The Agriculture Industry Cluster Team seeks to further the development of agriculture industry through the preservation of farmland and the establishment of essential infrastructure for community-based processing and direct marketing of locally produced agricultural goods.
(i) Industry strengths/opportunities:
•Productive soils and climate, combined with extensive irrigation infrastructure and a strong existing knowledge base among existing farmers;
•Growing and profitable market for value added products including lavender provides agri-tourism opportunities for small farms;
•Close proximity to Puget Sound wholesale food markets relative to California (two (2) days closer).
(ii) Industry weaknesses/threats:
•Limited agricultural land base, with rising pressure to convert to nonagricultural uses;
•Lack of available agricultural supply and processing infrastructure; difficult for start-up farms to compete, due to low production capacity and underdeveloped local markets;
•Competition for limited water resources.
(b) Building Trades. The Building Trades Cluster Team is a formation of the North Peninsula Builders Association, the realtors associations, and interested citizens. Cluster members include contractors, tradesman, vendors, developers, sales people, as well as residential and commercial lenders. The Building Trades Cluster is committed to providing a wide variety of product at the least possible cost.
(i) Industry strengths/opportunities:
•Growing demand for building trades services, especially with Clallam County’s national reputation as a retirement area;
•Diverse local base of small, independent businesses and skilled craftsmen and artisans.
(ii) Industry weaknesses/threats:
•Accurate data on economic contribution of sole proprietors in the industry;
•Shortage of skilled labor in the present population forces out-of-area contracting and job recruitment;
•Rising costs of land and housing are a barrier to market entry and affordable workforce housing;
•Lack of affordable medical health care/insurance results in large number of uninsured workers.
(c) Education. The “Education/Training Centers of Excellence” cluster team is made up of workforce professionals and educators from local school districts, the Skills Center, Peninsula College, four (4) year universities, Olympic Park Institute, the Employment Security Department/WorkSource, the Port of Port Angeles, Northwest Services Council, and private business owners that provide training. The members work together to improve economic conditions on the North Olympic Peninsula by developing business opportunities through increasing access to high quality education and training.
(i) Industry strengths/opportunities:
•Diverse local base of potential educators in fields such as information technologies, environmental sciences, law enforcement, aerospace, marine trades, manufacturing, and education;
•Support from the local community, I-5 corridor entities and other rural colleges;
•Existing training facilities, technological infrastructure (fiber-optic capacity), and industry infrastructure.
(ii) Industry weaknesses/threats:
•Limited training funds (e.g., educational industries, businesses, federal training development grants);
•Lack of community awareness regarding training needs;
•Geographic and economic isolation from I-5 corridor and associated “mainstream” resources.
(d) Finance. The Olympic Peninsula Finance Advisory Network (OPFAN) cluster team consists of representatives from local financial institutions, government representatives (Clallam County, Port of Port Angeles, USDA), educational representatives and financial consultants. OPFAN will assist new and existing businesses in locating sources of capital to start-up, enhance, and assure economic growth on the Olympic Peninsula. The intent of OPFAN is to provide financial consulting, education, and counseling and to act as a centralized resource group for possible sources of business financing.
(i) Industry strengths/opportunities:
•High level of cooperation and collaboration within OPFAN and with other entities such as the Clallam Business Incubator;
•Multiple local lending resources;
•Growing market for expansion within the institutional banking community.
(ii) Industry weaknesses/threats:
•Lack of private banking support for economic development activities;
•Limited OPFAN involvement by local banking institutions.
(e) Forest Resources. The Forest Resources Cluster Team is made up of representatives from logging and trucking companies, local wood products manufacturing industries, government representatives (USDA, DNR, Clallam County, city of Forks, etc.), timber companies, and private citizens. The Forest Resources Cluster Team seeks to identify opportunities to enhance the economic value of forest products business on the North Olympic Peninsula.
(i) Industry strengths/opportunities:
•Vast timber resources and wood product manufacturing facilities exist and continue to develop within the County;
•Community is generally supportive (especially in the west part of the County) of timber resource management and associated industry;
•Education, research institutions, and training centers exist within the County to support the need for trained and skilled forest resource workers;
•Wood biomass offers the opportunity for energy production.
(ii) Industry weaknesses/threats:
•Transportation disadvantage relative to many Puget Sound area mills;
•Market fluctuations and cyclical nature of industry reduces profitability and investment interest;
•Increasing environmental issues and associated regulations result in prolonged planning process for harvest management by government agencies, expensive mitigation requirements, and reduced predictability for future harvest prospects;
•Substitute products for structural wood components (steel, concrete, etc.).
(f) Health Services. The Health Services Cluster Team (“Transforming Healthcare in Clallam County” (THCC)) is composed of a wide variety of representatives from local public and private medical facilities, tribal clinics, County and city representatives, citizen groups, and other community representatives. The Health Services Cluster Team seeks to improve the quality, connectivity and financing of health care in Clallam County through the implementation of sustainable community focused programs that enhance existing healthcare efforts and encourage the seamlessness of delivery of care.
(i) Industry strengths/opportunities:
•Strong support for healthcare improvement from the local community, healthcare institutions, government agencies, and elected representatives;
•Partnerships exist and are expanding between local and national organizations, in addition to Medicare, Medicaid, and Tricare;
•Coordination efforts provide opportunity to transform healthcare access and delivery on a County-wide level.
(ii) Industry weaknesses/threats:
•Limited funding to accomplish THCC objectives;
•Deterioration of Medicare/Medicaid reimbursement rates;
•Distance to specialized equipment and health services in the I-5 corridor.
(g) Information Technology. The Information Technology Cluster Team consists of technology business owners, managers, and other members of the community interested in promoting a healthy technology business environment in Clallam County.
(i) Industry strengths/opportunities:
•Continuous and redundant fiber-optic loop has allowed for global connectivity three (3) times faster than comparable rural areas, making Clallam County an attractive location for IT-based or reliant industries;
•Growing demand for IT services by all business, government, and health-care sectors;
•Low overhead required to operate in Clallam County, relative to metropolitan areas;
•Conducive environment for conducting international business.
(ii) Industry weaknesses/threats:
•Competition from foreign low-wage workforce, and other jurisdictions attempting to brand as technology centers;
•Lack of stable, predictable and inexpensive transportation system;
•Lack of a clear, community-wide vision to become a technology center.
(h) Marine Services. The Marine Services Industry Cluster team consists of representatives from local marine transportation industries, government agencies (Port of Port Angeles, city of Port Angeles, USCG, Employment Security Dept.), Peninsula College, aquaculture industry, tribes, topside marine repair and fabrication businesses, and others. The Marine Services Cluster Team values cooperation among marine resource companies and with all marine organizations, while working together toward a common goal of a sustainable, thriving use of natural harbors, the Straits of Juan de Fuca and the rest of Clallam County’s marine resources.
(i) Industry strengths/opportunities:
•Vast marine resources, including the Strait of Juan de Fuca, Pacific Ocean, the longest County shoreline in the State, natural deep-water harbor, fish and shellfish resources;
•Expanding waterfront-based marine industries, including a growing yacht construction business, topside repair, launch services, marine fabrication, automobile and pedestrian transportation service, and growing marine tourism market;
•Existing marine infrastructure, including four deep-water marine terminals, log storage areas, protected marinas, U.S. Coast Guard base, existing successful aquaculture (Atlantic salmon) facility.
(ii) Industry weaknesses/threats:
•Extensive natural and cultural resources along shoreline areas limit new infrastructure development potential;
•Geographic isolation and lack of rail connection between Port facilities and I-5 corridor;
•Limited cargo handling capabilities, due to a lack of infrastructure and upland storage area at marine terminals and age of infrastructure.
(i) Tourism. The Tourism Cluster Team is made up of representatives from the County, cities, Port Angeles and Sequim-Dungeness Valley Chambers of Commerce, the Port Angeles Downtown Association, resort operators, private marketing and communications firms, local tour-guide businesses, local wineries, marine transportation companies, and others. The Tourism Cluster Team is committed to enhancing the economic well-being of the North Olympic Peninsula by using the region’s resources to attract guests to the area, and to show the economic strength of the industry and the impact tourism has on other areas of the economy.
(i) Industry strengths/opportunities:
•Marketing coordination with surrounding jurisdictions, municipalities, and within industry;
•Tremendous recreational opportunities exist within Clallam County including: Olympic National Park (ONP); County and State parks; National and State forestland; Strait of Juan de Fuca (fishing, shellfishing, boating, kayaking, sightseeing, transportation to British Columbia and the San Juan Islands); Native American communities; Olympic Discovery Trail; competitive biking, year-round touring and mountain biking, and commercial bike, walk and run events; and miles of shoreline, rivers, lakes, wildlife viewing and hunting;
•Festivals and events such as the Sequim Lavender Festival, Dungeness Crab and Seafood Festival, Sequim Irrigation Festival, Jazz in the Olympics, Juan de Fuca Festival, Salmon Derby, the North Olympic Discovery Marathon, etc. For example, the Lavender Festival attracts more than 25,000 people and continues to increase in attendance each year;
•Tribal tourism projects provide a unique opportunity for tourism industry enhancement;
•Proximity to Victoria, BC, provides unique opportunity for joint marketing and coordination.
(ii) Industry weaknesses/threats:
•Limited lodging and organized recreational activities;
•Lack of consistent regional branding.